Assessment Results
We want all children to be confident and successful learners who achieve the very best they can. We treat all children as individuals, carefully monitoring their progress and planning next steps on their learning journey. All staff are dedicated and committed to ensuring that children receive the best education they can.
Children’s progress is monitored regularly and updated on our tracking system each term.
We report children’s achievements through Parents’ Evenings and in the annual written school report.
Average scaled scores in Reading and Maths:
Our average reading scaled score is 109.
Our average maths scaled score is 108.
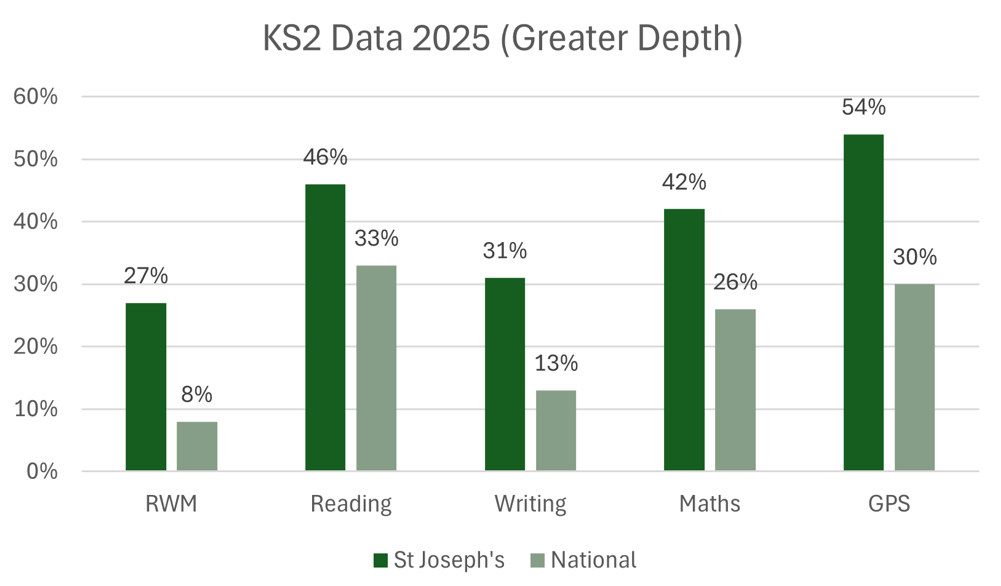
Please see below for our KS2 Performance for 2025:

Schools Performance Tables
Schools Performance Data may be found in the Performance Tables published by the Department for Education using the following link:
https://www.compare-school-performance.service.gov.uk/
You can check our latest school performance table by accessing the link below: